It predicts how many cycles a material can survive for a given stress amplitude, making it ideal for
high-cycle fatigue problems in metals, rotating machinery, automotive components, and aerospace structures.
1. What Is the Stress-Life (S–N) Method?
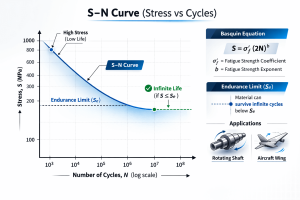
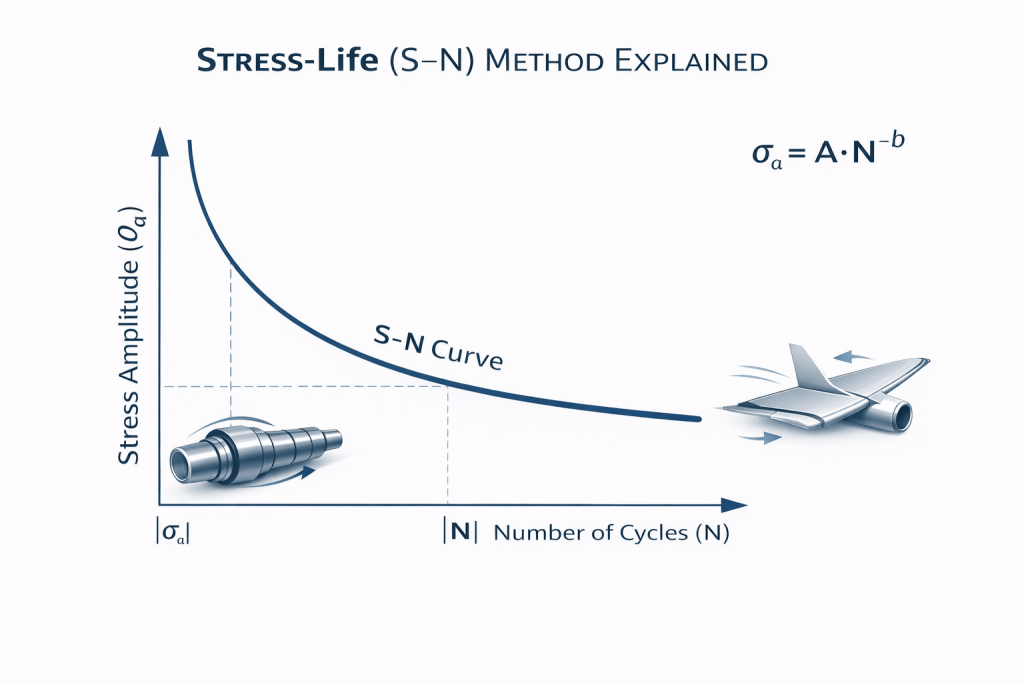
The S–N method relates stress amplitude (σₐ) to fatigue life (N) using an experimentally derived curve called the
S–N curve. Each point on the curve represents the number of cycles to failure at a specific stress level.
It is best suited for high-cycle fatigue (typically N > 10⁴ cycles) where elastic stresses dominate.
2. What Does an S–N Curve Show?
- X-axis: Number of cycles to failure (N)
- Y-axis: Stress amplitude (σₐ)
- Trend: As stress decreases, cycles to failure increase
- For steels: A horizontal “endurance limit” often appears
- For aluminum: No endurance limit — curve keeps dropping
3. Basquin’s Law (Mathematical Form)
The S–N relationship is often expressed using Basquin’s equation:
σₐ = A · (N)−b
Where:
- A = fatigue strength coefficient
- b = fatigue strength exponent (slope)
These values are obtained from the material’s S–N data and are used in fatigue calculators.
4. Endurance Limit (for Steels)
Many steels demonstrate an endurance limit — a stress level below which the material can theoretically withstand an
infinite number of cycles.
For example:
- 1045 Steel endurance limit ≈ 0.5 × UTS
- 4140 Steel endurance limit ≈ 305–420 MPa
Aluminum and stainless steels do NOT exhibit true endurance limits.
5. When Should You Use the S–N Method?
- High-cycle fatigue (N > 10⁴–10⁵)
- Components mostly in elastic range
- Rotating shafts, gears, turbines, fans
- Automotive & aerospace structures
- Any part experiencing repeated fluctuating stresses
6. Limitations of the Stress-Life Method
- Not suitable for low-cycle fatigue (plastic deformation)
- Sensitive to surface finish and stress concentrations
- S–N curves are typically material-specific
- Mean stress effects require correction models
7. Mean Stress Correction Models
Since S–N curves are generated under fully-reversed loading (mean stress = 0), real-world loads require correction using:
- Goodman (most common)
- Gerber (parabolic, more accurate for ductile materials)
- Soderberg (more conservative)
8. Using S–N Method in Fatigue Calculations
You can directly apply S–N data inside the FatigueLab Detailed Damage Calculator by entering:
- Stress amplitude (from your stress-time history)
- Mean stress
- S–N parameters (A and b)
- Endurance limit (if applicable)
The tool then computes cycles, damage fraction, and expected fatigue life.
9. Summary
The Stress-Life (S–N) method remains one of the most powerful fatigue tools for high-cycle fatigue problems.
It is simple, robust, and backed by decades of experimental data. When combined with proper mean stress correction
and material parameters, it provides a reliable way to estimate fatigue life for real engineering components.